Understanding image quality metrics is essential for enhancing and evaluating photographs, especially in specialized fields like professional breed assessment. These metrics provide quantitative measures for various aspects of image quality, including sharpness, texture, noise, and the presence of artifacts.
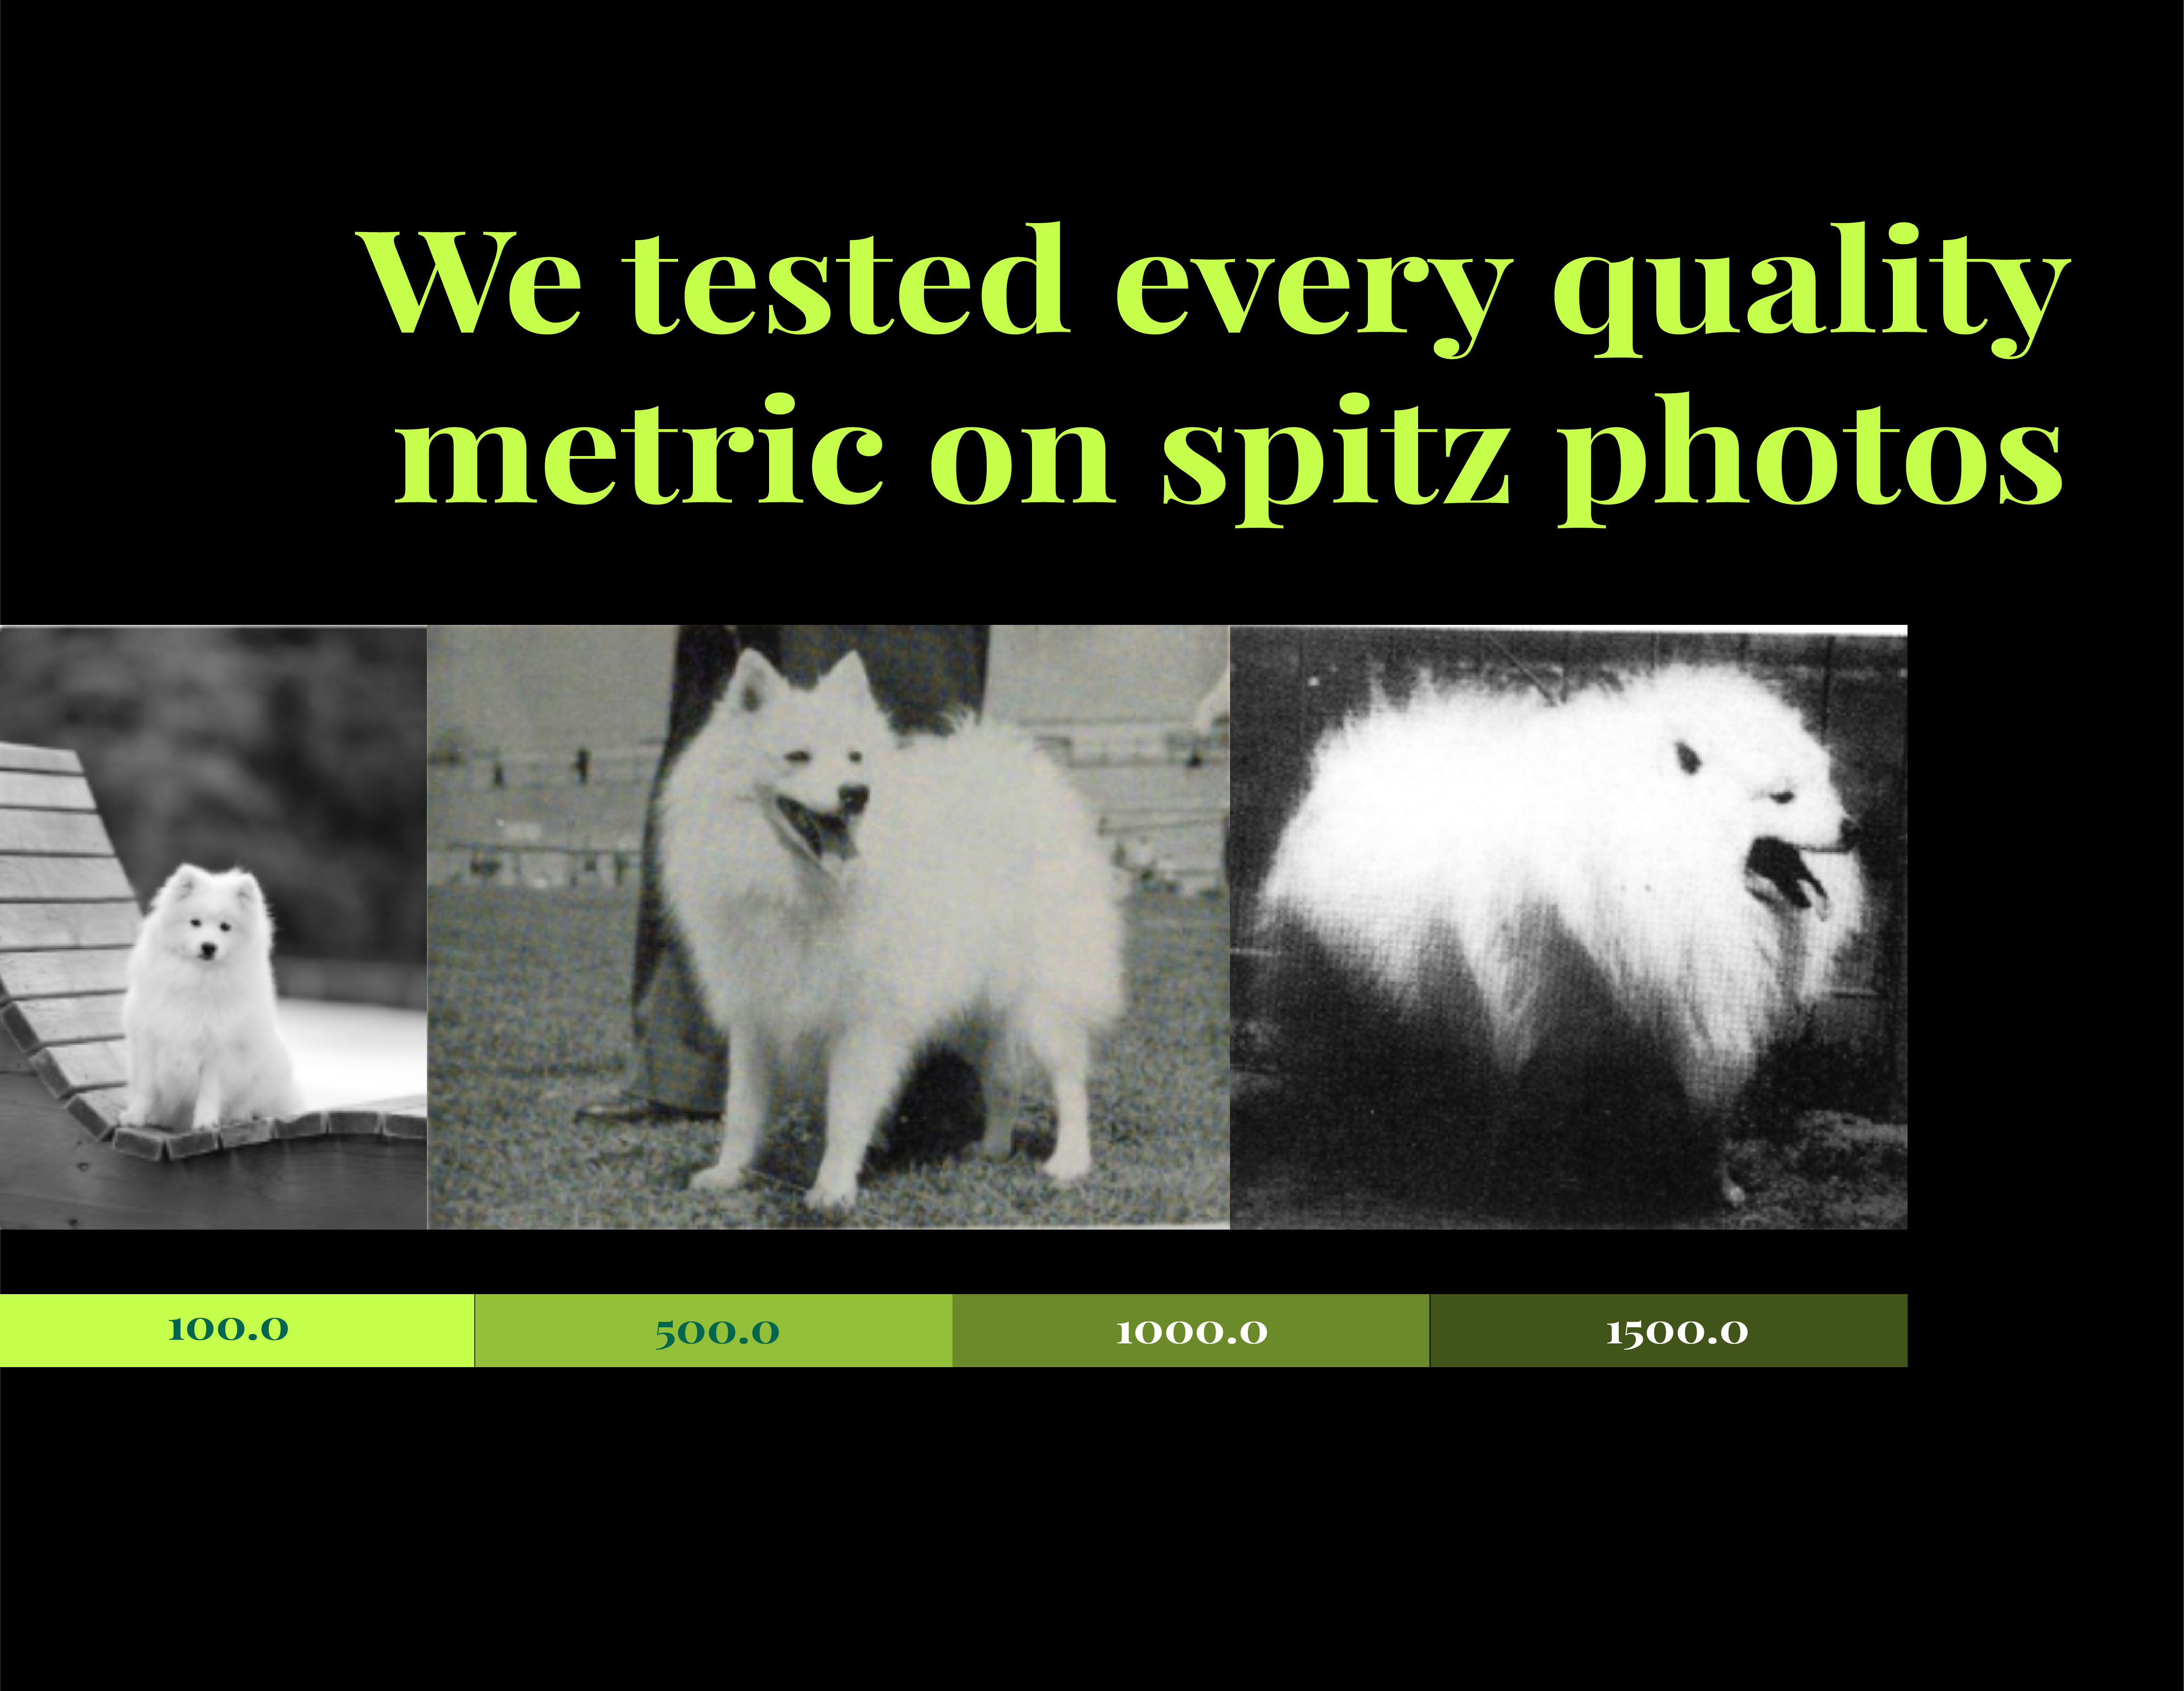
Consider the task of restoring old black-and-white photographs of Japanese Spitzes. Here, preserving and enhancing fur details isn’t just about aesthetics – it’s vital for accurate breed evaluation. To ensure these enhancements meet high standards, we need a robust set of metrics to assess image quality objectively.
This guide will walk you through key image quality metrics and the results they’ve shown in tests. You will also find a set of recommended metrics with their expected values.
Metrics without a reference image
These metrics evaluate image quality based solely on the image’s own characteristics, proving useful when a reference image is unavailable.
1. Variance of the Laplacian
What it measures: Sharpness and focus
How it works: Analyzes brightness changes between pixels using the Laplacian operator
Interpretation: Higher values typically indicate clearer, more focused images
Caution: May show high values for noisy or highly textured images, even without proper focus
Recommendation: Use with proper preprocessing, like noise filtering
Validity: ✅ Valid for image quality evaluation

2. Image entropy
What it measures: Information diversity (unique details and textures)
Interpretation: High entropy suggests diverse image elements
Caution: Noisy images can also have high entropy due to random variations
Validity: ✅ Valid, but use in combination with other metrics

3. Dynamic range metrics
What it measures: Range of intensities from darkest to brightest points
Importance: Crucial for preserving details in shadows and highlights
Caution: Wide range can result from over or underexposure in certain areas
Recommendation: Balance exposure during preprocessing
Validity: 👀 Use with caution, combine with other metrics

4. Gradient contrast
What it measures: Sharpness and contrast
How it works: Analyzes brightness changes between adjacent pixels, especially along object edges
Interpretation: High values indicate clear boundaries and details
Caution: May show high values in noisy images due to random sharp transitions
Recommendation: Use preliminary filtering
Validity: ✅ Valid for image quality evaluation

5. Tenengrad (Tenenbaum sharpness metric)
What it measures: Image sharpness using brightness gradients
Interpretation: Higher values suggest more focused images
Caution: May show high values for images with high texture or noise, even without proper focus
Recommendation: Apply filtering before use
Validity: ✅ Valid and well-established metric

6. Blockiness
What it measures: Degree of block artifacts from image compression
Interpretation: Low values indicate smooth images without visible blocks
Caution: Low values can also mean weakly expressed artifacts
Validity: ✅ Valid, especially for detecting compression artifacts

7. FWHM (Full width at half maximum)
What it measures: Degree of detail blurring
How it works: Assesses width of brightness peak at half its maximum
Interpretation: Smaller values indicate sharper details
Limitations: More suitable for point light sources, less accurate in complex scenes
Caution: Requires precise peak detection, challenging to automateValidity: 👀 Use with caution, can be difficult to interpret

8. GLCM (Gray level co-occurence matrix)
GLCM is sensitive to the scales and orientations of textures, which can affect results when the image scale changes. This applies to all the metrics below:
Contrast: High contrast indicates the presence of clear edges and details, while low contrast suggests a uniform or blurred image. ✅ Valid.

Dissimilarity: Measures the difference between pairs of pixels; high values indicate diverse texture. But it heavily depends on the context. ❌ Not valid.

Homogeneity: Shows uniformity. High values indicate smooth transitions in brightness. ✅ Valid.

Energy: Reflects pattern repeatability. High values indicate regular textures. ✅ Valid.

ASM (Angular second moment): Texture Regularity Index. High values indicate uniform and regular textures. ✅ Valid.

9. Congruency
What it measures: Degree of symmetry or consistency
Interpretation: High values indicate similarity across image parts
Limitation: May show low values in complex scenes even with high image quality
Caution: Requires frequency domain transformations
Validity: ✅ Valid for evaluating significant features

10. JNB (Just noticeable blur)
What it measures: Minimum level of blur noticeable to the human eye
Interpretation: Low values indicate sharp-appearing images
Limitation: Less accurate in low-contrast images
Validity: ❌ Not recommended (Laplacian and Tenengrad methods are superior)

11. NIQE (Naturalness image quality evaluator)
What it measures: Quality based on statistical models of natural images
Interpretation: Low values indicate high quality without visible distortions
Limitation: May interpret high-detail images as “noisy”
Validity: 👀 Use with caution, especially for general quality assessment

12. BRISQUE (Blind/referenceless image spatial quality evaluator)
What it measures: Quality based on spatial characteristics
Interpretation: Low values indicate better quality and fewer visible artifacts
Use case: Can predict artifacts noticeable to the eye
Limitation: Does not fully replace reference methods
Validity: ✅ Valid for identifying low-quality images and various distortions

Metrics with a reference image
These metrics compare image quality against a known reference, focusing on differences in color, structure, and overall fidelity.
1. PSNR (Peak signal-to-noise ratio)
What it measures: Degree of distortion compared to the original
How it works: Calculates ratio between maximum signal power and noise
Interpretation: High values indicate less distortion
Limitation: Less effective for highly compressed or structurally complex images
Validity: ✅ Valid and widely used


2. SSIM (Structural similarity index)
What it measures: Similarity based on structure, brightness, and contrast
Interpretation: Values close to 1 indicate high structural similarity
Caution: May decrease with noise or textural differences, even if overall perception is similar
Validity: ✅ Valid for comparing images and evaluating post-processing quality


3. SNR (Signal-to-noise ratio)
What it measures: Ratio of useful signal-to-noise level
Interpretation: High values indicate clear details with minimal noise
Limitation: Context-dependent, less informative when comparing different image types
Validity: ✅ Valid for assessing image noise levels


4. VIF (Visual information fidelity)
What it measures: Preservation of visual information compared to the original
Interpretation: High values indicate minimal quality and detail loss
Limitation: May not reflect subjective aspects like texture or artifact perception
Validity: ✅ Valid and informative for reference comparisons


Recommended metrics and their interpretations
Based on our research and tests, we can recommend the following set of metrics and their values:

👀 Note: Consider using texture metrics based on GLCM and artifact evaluation metrics, but be aware of their limitations and potential ambiguity.
General recommendations
- Comprehensive approach: Employ a combination of metrics for a complete picture of image quality.
- Artifact removal: Assess the effectiveness of artifact removal using both metrics and visual analysis.
- Reference images: Use reference images for calibration and comparison when possible.
Future directions
While we’ve established a robust set of metrics, challenges remain in interpretation and application:
- Metric interpretation: Developing a clear system for interpreting these metrics in combination is crucial.
- Object-specific evaluation: Current metrics evaluate the entire image. We need methods to assess specific objects of interest (e.g., a dog in the image). ML-based metrics can work for this purpose.
- Criteria for “good” images: Establishing concrete criteria for what constitutes a “good” image in our context is essential.
By continually refining our approach to image quality metrics, we can ensure that our image enhancement techniques produce the best possible results for professional breed assessment and beyond.
At Furnets, we love experimenting with new technologies and are eager to help you achieve the best image quality possible. Reach out to us for expert guidance and innovative solutions tailored to your needs.
Leave a Reply