
Our first article in this series covered the theory behind visual perception. Now we’ll roll up our sleeves and build it.
In this part, you’ll learn how we coded a model that processes images like your brain does. We’re moving beyond black-box algorithms that accidentally match human judgments.
Instead, we’ll create a system that mimics your visual processing – step by step, from basic contrast detection to understanding meaning.
Implementing the brain’s visual processing in software
Turning biological theory into working code is reverse-engineering nature. We’re not creating algorithms from scratch. Instead, we’re reconstructing a computational pipeline refined by millions of years of evolution.
Our goal isn’t to simulate every neuron (impossible and unnecessary), but to build a functional equivalent. A system that takes the same input (pixels) and produces output (importance maps) that matches what our brains create.
Step 1. Mimicking the retina: early visual processing
The first step is eliminating unnecessary information. The mammalian brain doesn’t initially process color the way computers store RGB values. Instead, it focuses on highlighting changes and contrasts.
What happens in nature: ON and OFF ganglion cells in your retina respond to light appearing or disappearing in their receptive field centers.
How we code this: We convert the image to grayscale and apply the Laplacian operator (second derivative). This isn’t a random choice. It’s the mathematical equivalent of how contrast detectors work. The Laplacian detects areas of rapid brightness change (edges). The result is a map where pixel brightness shows edge strength – exactly what ganglion cells send to your brain through the optic nerve.
In parallel, we calculate local contrast by subtracting a heavily blurred version of the image from itself (using Difference of Gaussians or DoG). This technique captures sharp boundaries, as well as softer textures and transitions, mimicking how the periphery of receptive fields responds.

Step 2. Simulating level V1: detection of oriented features
Raw contrast information isn’t useful without organization. Your primary visual cortex’s main job is answering: “Which way is this edge pointing?”
- What happens in the brain: Simple and complex cells in your V1 cortex each respond to lines or edges at specific angles (0°, 45°, 90°, 135°, etc.).
- How we code this: We use a set of Gabor filters to model this neural system. A Gabor filter combines a wave pattern (that responds to specific orientations) with a Gaussian envelope (that limits the effect to a local area, like a neuron’s receptive field). These aren’t just convenient filters – their design comes directly from experiments studying primate vision.
Step 3. Level V2/V4: integration into textures
Next, your brain assembles basic features (lines and edges) into more complex patterns.
- What happens in the brain: Neurons in your secondary visual cortex respond to corners, textures, and simple geometric shapes.
- How we code this: To isolate just the texture information (separate from overall shape and lighting), we use band-pass filtering. This technique highlights a specific range of spatial frequencies in the image.
Low frequencies (which we filter out) carry information about gradual brightness changes like overall lighting and object shape. High frequencies usually represent noise and extremely sharp edges. But medium frequencies – that’s where texture information lives. Animal fur, fabric, brick walls – all these patterns exist primarily in the medium frequency range.
Our model emphasizes this medium frequency band, creating a map where areas with distinctive texture (like the thick fur on a Spitz’s chest) show maximum activity.

Step 4. Level IT: semantic interpretation via vision-language models
This is the highest and most complex processing level to model. Here, patterns transform into meaning.
- What happens in the brain: Neurons in your inferotemporal cortex (IT), including those in the Fusiform Face Area (FFA), respond to specific object categories and their parts: “face,” “eye,” “animal.”
- How we code this: Approximating IT cortex function means teaching a machine to understand what’s in an image patch. Today’s most powerful tools for this are Vision-Language Models (VLMs) like CLIP. They’re trained on millions of “image-text” pairs from the internet, creating a shared semantic space for visual and textual concepts.
We implement this using the following pipeline:
- Patching. We divide the image into many overlapping regions (patches).
- Semantic scoring. We encode each patch using CLIP’s image encoder. At the same time, we encode textual prompts describing key concepts for our task: “clear eyes of a dog”, “fluffy fur of a dog”, “dog nose and muzzle”, “pointed dog ears”.
- Matching. For each patch, we calculate how similar its vector representation is to each text prompt vector (using cosine similarity). High similarity means CLIP “sees” in this patch what the prompt describes.
- Map construction. We combine these similarity values into a dense semantic significance map. The brightness of each pixel shows how confident the model is that this area contains something semantically important (eyes, nose, fluffy fur).
This creates a functional equivalent of top-down attention, where a specific task (finding “eyes”) guides how visual information gets processed.

Step 5. Final integration: modeling the work of the parietal cortex
In your brain, these visual processes don’t happen in isolation. All these pathways combine their information to create a unified attention field.
- What happens in the brain: The parietal cortex, especially the ventral stream (“what pathway”) and dorsal stream (“where pathway”), integrates information about object properties and their locations to direct your attention.
- How we code this: We combine all our maps using a weighted linear sum: Final_Saliency = α × LowLevel_Saliency + β × Semantic_Saliency + γ × Center_Prior
Where:
- LowLevel_Saliency combines maps from the Laplacian, Gabor, and texture filters (bottom-up attention)
- Semantic_Saliency is the map from CLIP (top-down, task-driven attention)
- Center_Prior is a Gaussian distribution that gives preference to the center of the frame (an evolutionary and cultural bias – photographers usually place subjects in the center)
We set the coefficients α, β, γ to 0.35, 0.55, and 0.10 based on testing. These values reflect an important biological reality: semantic meaning dominates how humans direct their attention when viewing meaningful scenes.
This table shows how we’ve matched each part of the human visual system with specific programming techniques:
| Biological system | Primary function | Computational model | Mathematical justification |
| Retina (Ganglion cells) | Detection of contrasts and edges | Laplacian operator, local contrast calculation | Calculation of the second derivative (brightness gradient) to detect rapid changes in the signal. |
| Primary cortex (V1) | Detection of oriented lines | Bank of Gabor filters | Approximation of simple cell receptive fields using harmonic functions confined by a Gaussian window. |
| Secondary cortex (V2/V4) | Integration of lines into textures | Band-pass filtering | Selection of a specific range of spatial frequencies corresponding to textural patterns. |
| Inferotemporal cortex (IT) | Semantic categorization | Vision-language model (CLIP) | Matching vector representations of image patches and textual descriptors in a common semantic space. |
| Parietal cortex | Integration of information streams | Weighted linear combination of maps | Optimal combination of heterogeneous features into a single map of behavioral relevance. |
Correspondence of biological systems and computational methods for their modeling
How our bio-inspired model reveals what matters in images
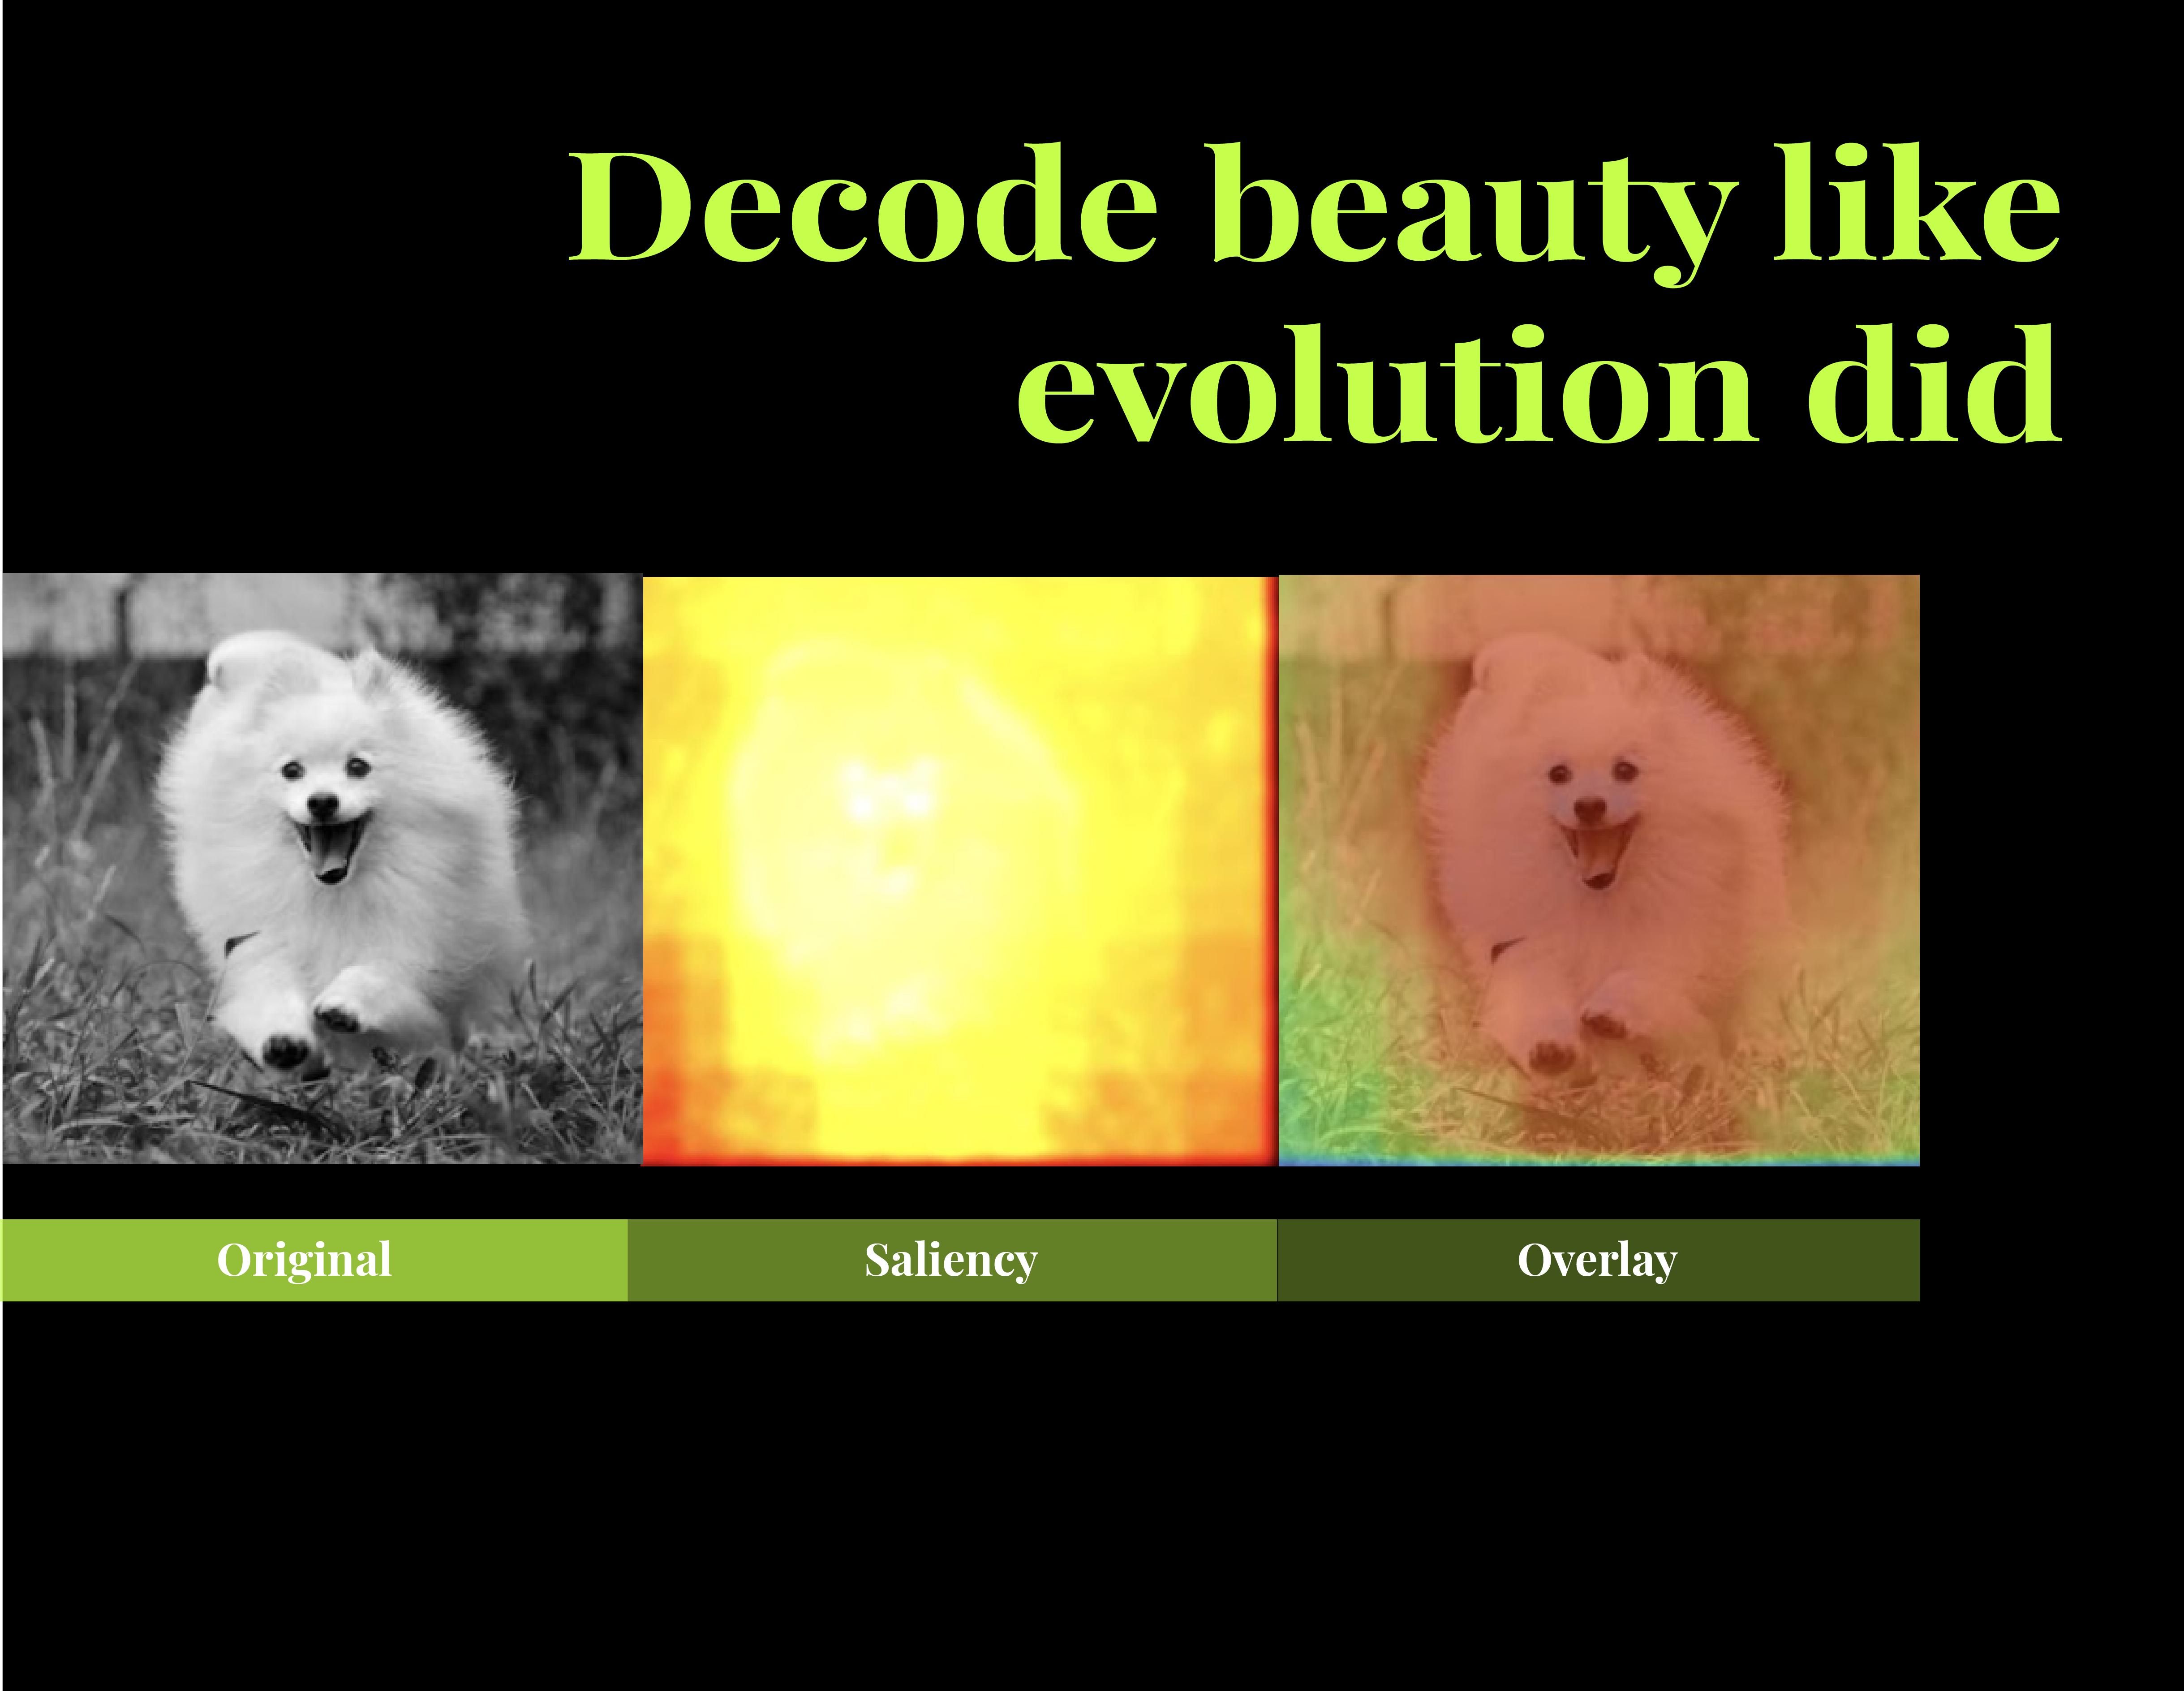
We tested our biology-based approach by analyzing the saliency maps it generated for Japanese Spitz dog photos. Success wasn’t just about creating nice-looking heatmaps. We wanted the model to consistently highlight the specific areas that most influence how people judge the dog’s quality.
When we examined the results, we found these patterns:
Eyes: where contrast and meaning meet
The eye area consistently gets the highest activation on our final attention maps. This happens naturally due to how our hybrid model works:
- Low-level filters (Retina/V1): The strong contrast between iris, pupil, and sclera, plus the distinct circular shape, triggers strong responses from our Laplacian operator and Gabor filters.
- Semantic level (IT cortex): When prompted with “clear eyes of a dog,” the CLIP model generates particularly strong responses in this region.
When these two signals combine, the eyes get highlighted more clearly and sharply than either approach could manage on its own.
Muzzle and nose: where shape meets meaning
The dog’s facial region (muzzle, nose, and bridge) consistently appears as a high-importance area in our maps.
- Low-level filters: The nose typically shows strong texture and sharp brightness contrasts (dark nose against light fur), which strongly activates our contrast detectors.
- Semantic level: Text prompts like “dog nose and muzzle” and “pointed dog ears” direct CLIP’s attention to these areas, providing semantic justification for their importance.
Fur texture: turning patterns into quality indicators
One of our most impressive results is how the model handles fur. Simple edge detectors would highlight each individual hair strand, creating visual “noise.” Our multi-level processing approach instead aggregates this information meaningfully:
- V2/V4 level (textures): Our band-pass filter removes overall lighting effects while isolating mid-frequency patterns – exactly where fur density, fluffiness, and uniformity information lives.
- Semantic level: The prompt “fluffy fur of a dog” helps the model interpret these textures as meaningful quality attributes rather than just noise.

As a result, areas with evenly distributed, fluffy, well-defined fur (typically around the chest, neck, and muzzle) consistently receive medium-to-high activation. Meanwhile, matted or unkempt fur areas and low-resolution regions remain properly de-emphasized.
Peripheral areas and background: effective suppression
Equally important is what our model chooses to ignore. Uniform backgrounds, blurred image regions, and accessories all receive minimal values on our saliency maps. This shows the model successfully functions as a biological filter – removing informational noise while preserving only what’s semantically and perceptually relevant.
Our qualitative analysis confirms that our architecture doesn’t just generate generic attention maps. It produces structurally grounded visual importance maps that directly correlate with the same attributes human experts intuitively use when evaluating pedigree dog quality in photographs.

What’s next: from understanding attention to predicting quality
Our saliency map isn’t the end product. It’s a foundation and explainability tool for our ultimate goal: building a model that can predict aesthetic quality.
1. Testing against humans and existing models
First, we’ll benchmark our model against leading saliency models (like DeepGaze and ML-Net) and, more importantly, against real eye-tracking data from humans viewing Japanese Spitz photos.
2. Enhancing vision transformers with attention maps
Our key idea for future work is using our saliency maps to guide feature extraction in Vision Transformers (ViT). Standard ViTs treat all image patches equally. We’ll modify this approach by weighting each patch’s features according to its saliency value:
Final_Feature_Vector = Σ (Saliency_Patchᵢ × Feature_Vector_Patchᵢ)
This means our model will learn primarily from regions that matter to humans, rather than processing all pixels equally. This approach should improve generalization, reduce overfitting on background elements, and directly incorporate human perception into the training process. Our quality scores (like 1-10 ratings) will have clear, interpretable connections to key visual attributes.
3. Making AI decisions transparent
By design, our model is inherently explainable. Users won’t just get a bare score like “7/10.” They’ll see a visual map showing why that score was given: “The eye region scored highly and boosted your rating, but the blurry fur texture on the back was ignored by the model, preventing a top score.”
This creates opportunities for automated systems that can suggest specific improvements.
Final thoughts
Our bio-inspired saliency model is a fundamental step toward building truly human-like, explainable systems for assessing visual content. It bridges the gap between raw pixels and high-level understanding, enabling effective solutions for tasks where human perception is the deciding factor.
Stay tuned for the next parts of our experiments!
Leave a Reply